关于阴影作图,那些你还不知道的玩法
在往期推文“area & rarea——我填了谁的阴影”中我们介绍了命令area和rarea的区别,并学习了一些简单用法。其实阴影作图的用法可不止如此呢!今天小编就带着大家一睹为快啦!

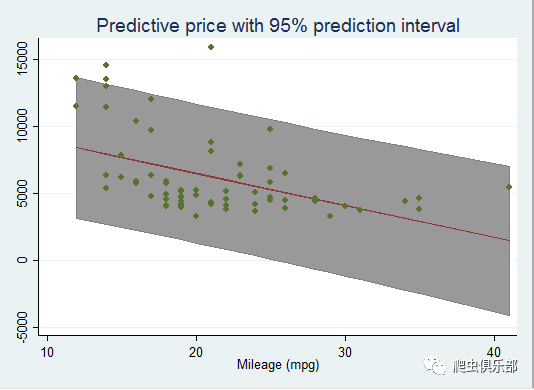
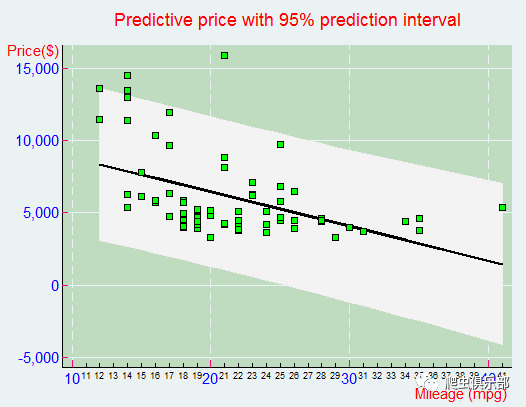
大家还记得在推文“area & rarea——我填了谁的阴影”的文末,我们介绍了用命令rarea绘制置信区间的例子吗?今天小编要告诉大家的是,在预测分析的案例中,为了更好的评价预测的好坏,我们还需要绘制预测区间,而且在预测区间中添加预测曲线和实际值的分布,能更好的说明问题。那如何实现呢?请看下面的具体代码:
sysuse auto,clear
quietly regress price mpg
predict pprice
predict s, stdf
gen low = pprice - 1.96*s
gen hi = pprice + 1.96*s
twoway rarea low hi mpg, sort color(gray) ///
||line pprice mpg || scatter price mpg, ///
title(Predictive price with 95%prediction interval) legend(off)

不止是预测区间和置信区间的绘制中会用到阴影区域,有时候stata制作的其他图形也要用到区间强调,主要有区间的纵向强调和横向强调。下面我们引入具体的例子进行介绍。
首先以系统数据sp500为例介绍区间的纵向强调,假设我们重点强调1-2月份和7-8月份的数据,就可以执行下面的命令来实现:
sysuse sp500,clear
twoway functiony=64.29004,range(14977 15034) recast(area) color(gs12) base(-54) || ///
function y=64.29004,range(15158 15218) recast(area) color(gs12) base(-54) || ///
function y=-50,range(14977 15218) lstyle(grid)|| ///
function y=0,range(14977 15218) lstyle(grid)|| ///
function y=50,range(14977 15218) lstyle(grid)|| ///
spike change date,xlabel(,format(%td)) legend(off) ytitle(change) xtitle(date)
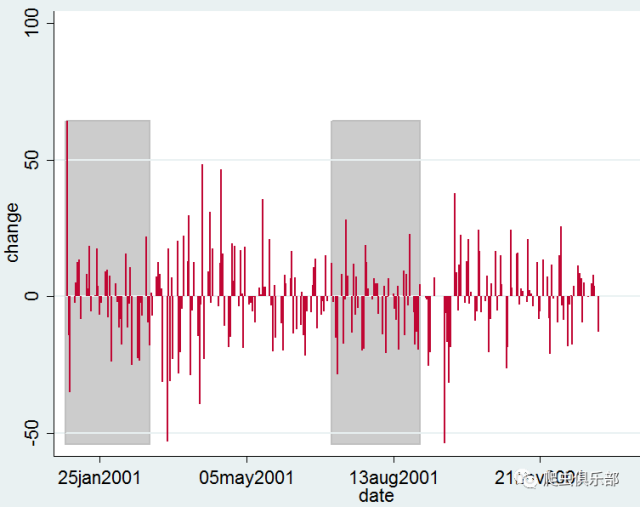
注:命令中y的值是变量change的最大值;选项base中是变量change的最小值;选项range中的数值分别是变量date的值。
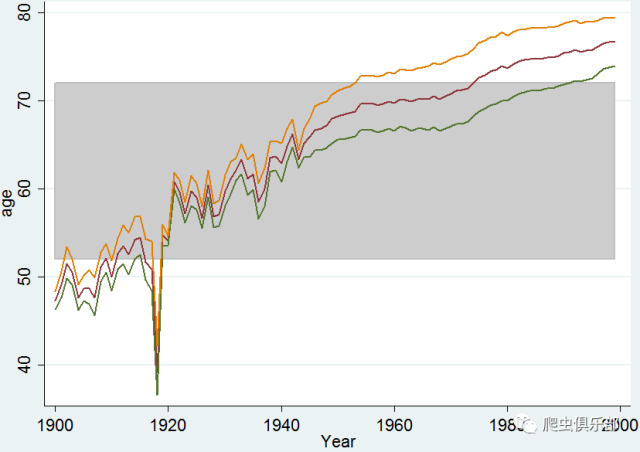
接下来以系统数据uslifeexp为例,介绍区间的横向强调。假设我们要观察人均寿命及男、女人均寿命在1990-2000年的变化趋势,并要直观的看到寿命在52-72岁之间的三者分布情况,就可以执行如下命令来实现。
sysuse uslifeexp,clear
gen z1=72
gen z2=52
twoway rarea z1 z2 year,color(gs12) ||line le year||line le_male year ///
||line le_female year,legend(off) ytitle(age)
就上面的例子,如果我们是想比较美国整体、白人和黑人之间的预期寿命的差异,可以将所有的图形组合在一起,具体命令行如下:
sysuse uslifeexp,clear
graph drop _all
gen z1=72
gen z2=52
twoway rarea z1 z2 year,color(gs12)||line le year||line le_male year ///
||line le_female year,legend(off) ytitle(age) title("U.S. life expectancy") saving(graph1)
twoway rarea z1 z2 year,color(gs12)||line le_w year||line le_wmale year ///
||line le_wfemale year,legend(off) ytitle(age) title("white lifeexpectancy") saving(graph2)
twoway rarea z1 z2 year,color(gs12)||line le_b year||line le_bmale year ///
||line le_bfemale year,legend(off) ytitle(age) title("black lifeexpectancy") saving(graph3)
graph combine graph1.gph graph2.gph graph3.gph,hole(2)
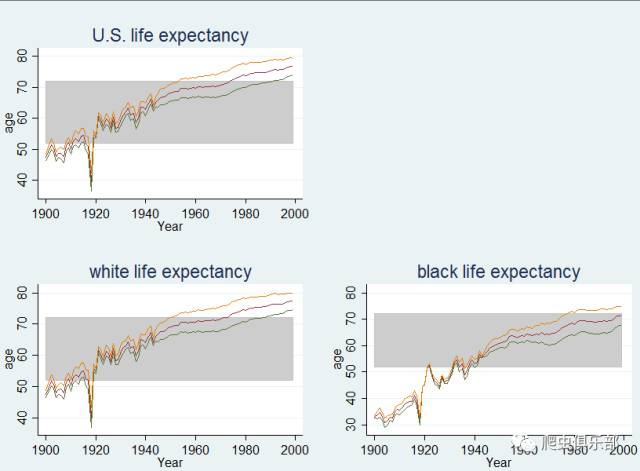
注:选项hole指第2个位置处不画图。

如果对图形的外观不太满意还可以进行修改,而stata有关图形编辑的命令有非常多,不易记住。我们一般选择在图形编辑器中进行修改。但有的时候会有意外发生,或是没有及时保存修改后的图片,或是对前面的修改还不满意,在爬虫酱看来这些统统都不是事。之前的推文“绘图神器—gr_edit,妈妈再也不用担心我的画图”中已经说过如何保存图形编辑的痕迹啦,今天我们以上面第一个例子为例,继续分享关于gr_edit的好用之处。
打开图形编辑器进行操作并保存相关操作至文件modify.grec,假设我们修改后图形如下图所示,可以看出图形的背景色、坐标以及形状颜色都发生了变化。
此时,打开文件modify.grec,可以看到相关命令语句已生成,限于篇幅原因我们仅展示图形标题和纵坐标的修改如下图所示:
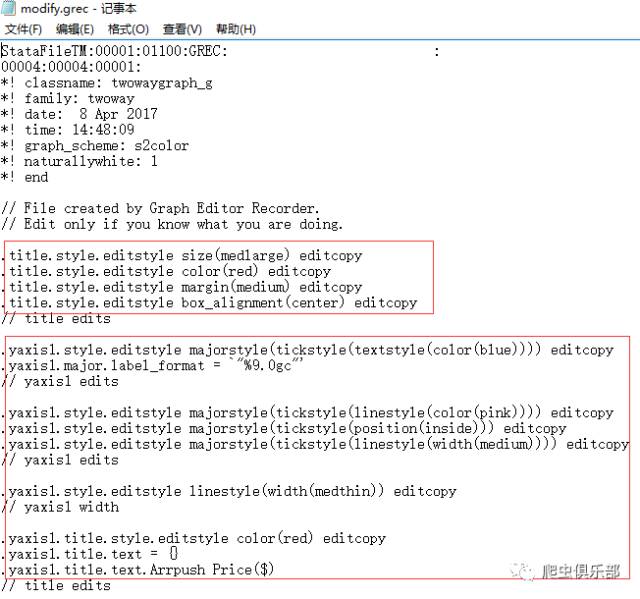
如果你不小心弄丢了之前修改过的图片,或是对之前的修改仍然不满意,就不用重新打开图形编辑器了,只需将文件中相关命令复制到stata中运行,记得在执行命令前加上gr_edit进行调用,如下命令行:
gr_edit title.style.editstyle size(medlarge) editcopy
gr_edit title.style.editstyle color(red) editcopy
gr_edit title.style.editstyle margin(medium) editcopy
gr_edit title.style.editstyle box_alignment(center) editcopy // title edits
gr_edit yaxis1.style.editstyle majorstyle(tickstyle(textstyle(color(blue)))) editcopy
gr_edit yaxis1.major.label_format = `"%9.0gc"' // yaxis1 edits
gr_edit yaxis1.style.editstyle majorstyle(tickstyle(linestyle(color(pink)))) editcopy
gr_edit yaxis1.style.editstyle majorstyle(tickstyle(position(inside))) editcopy
gr_edit yaxis1.style.editstyle majorstyle(tickstyle(linestyle(width(medium)))) editcopy
gr_edit yaxis1.style.editstyle linestyle(width(medthin)) editcopy // yaxis1 width
gr_edit yaxis1.style.editstyle majorstyle(tickangle(horizontal)) editcopy
gr_edit yaxis1.title.style.editstyle color(red) editcopy
gr_edit yaxis1.title.text = {}
gr_edit yaxis1.title.text.Arrpush Price($)
gr_edit yaxis1.title._set_orientation horizontal // title justification
gr_edit yaxis1.title.DragBy 34.85257429146146 12.28848782562559 // title reposition
gr_edit plotregion1.style.editstyle boxstyle(shadestyle(color(olive_teal))) editcopy
gr_edit plotregion1.style.editstyle boxstyle(linestyle(color(olive_teal))) editcopy // plotregion1 color
gr_edit xaxis1.style.editstyle majorstyle(tickstyle(textstyle(color(blue)))) editcopy // xaxis1 color
gr_edit xaxis1.style.editstyle majorstyle(tickstyle(linestyle(color(pink)))) editcopy
gr_edit xaxis1.style.editstyle majorstyle(tickstyle(position(inside))) editcopy
gr_edit xaxis1.style.editstyle majorstyle(tickstyle(linestyle(width(medium)))) editcopy // xaxis1 edits
gr_edit xaxis1.style.editstyle linestyle(width(medthin)) editcopy // xaxis1 width
gr_edit xaxis1.style.editstyle draw_major_grid(yes) editcopy
gr_edit xaxis1.style.editstyle majorstyle(gridstyle(linestyle(pattern(dash)))) editcopy // xaxis1 edits
gr_edit xaxis1.title.style.editstyle color(red) editcopy
gr_edit xaxis1.title.style.editstyle box_alignment(east) editcopy // title edits
gr_edit xaxis1.style.editstyle minornlstyle(tickstyle(position(inside))) editcopy // xaxis1 compass position
gr_edit xaxis1.reset_rule 10, tickset(minornl) ruletype(suggest_between) // xaxis1 edits
gr_edit xaxis1.style.editstyle minornlstyle(tickstyle(show_labels(yes))) editcopy // xaxis1 edits
gr_edit xaxis1.reset_rule 10, tickset(minornl) ruletype(suggest_between) // xaxis1 edits
gr_edit plotregion1.plot3.style.editstyle marker(size(medsmall)) editcopy
gr_edit plotregion1.plot3.style.editstyle marker(symbol(square)) editcopy
gr_edit plotregion1.plot3.style.editstyle marker(fillcolor(lime)) editcopy
gr_edit plotregion1.plot3.style.editstyle marker(linestyle(color(black))) editcopy
gr_edit plotregion1.plot3.style.editstyle marker(linestyle(width(thin))) editcopy // plot3 edits
gr_edit plotregion1.plot2.style.editstyle line(color(black)) editcopy
gr_edit plotregion1.plot2.style.editstyle line(width(medthick)) editcopy // plot2 edits
gr_edit plotregion1.plot1.style.editstyle area(shadestyle(color(gs15))) editcopy
gr_edit plotregion1.plot1.style.editstyle area(linestyle(color(gs15))) editcopy
gr_edit plotregion1.plot1.style.editstyle area(linestyle(width(thin))) editcopy // plot1 edits
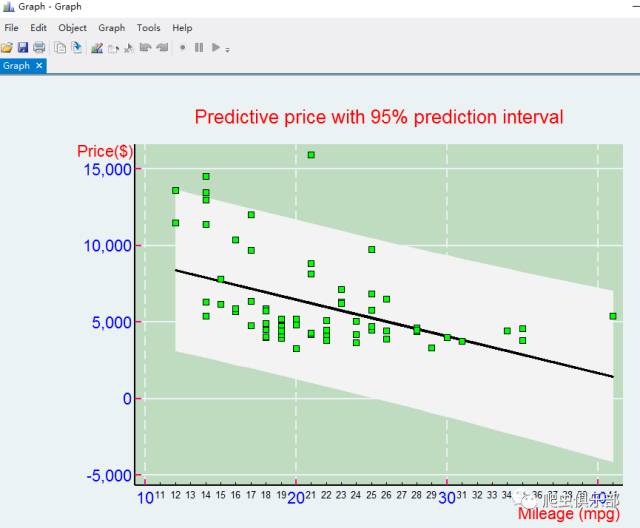
可以看到我们一次性就得到了相同的图形。
萝卜青菜各有所爱,或许你对小编的所绘制图仍然不欣赏~这当然不是重点,只要学习了新技能,就赶快去学习自己所爱的绘图吧!

以上就是今天给大家分享的内容了,说得好就赏个铜板呗!有钱的捧个钱场,有人的捧个人场~。
应广大粉丝要求,爬虫俱乐部的推文公众号打赏功能可以开发票啦,累计打赏超过1000元我们即可给您开具发票,发票类别为“咨询费”。用心做事,只为做您更贴心的小爬虫。第一批发票已经寄到各位小主的手中,大家快来给小爬虫打赏呀~
文字编辑:强宇曦
技术总编:刘贝贝
往期推文推荐:
7.一言不合就用stata写邮件(Outlook/Foxmail)
9.I have a Stata, I have a python
10.I have a Stata, I have a Python之二——pdf转word
关于我们
微信公众号“爬虫俱乐部”分享实用的stata命令,欢迎转载、打赏。爬虫俱乐部是由李春涛教授领导下的研究生及本科生组成的大数据分析和数据挖掘团队。
此外,欢迎大家踊跃投稿,介绍一些关于stata的数据处理和分析技巧。
投稿邮箱:statatraining@163.com
投稿要求:
1)必须原创,禁止抄袭;
2)必须准确,详细,有例子,有截图;
注意事项:
1)所有投稿都会经过本公众号运营团队成员的审核,审核通过才可录用,一经录用,会在该推文里为作者署名,并有赏金分成。
2)邮件请注明投稿,邮件名称为“投稿”+“推文名称”。
3)应广大读者要求,现开通有偿问答服务,如果大家遇到关于stata分析数据的问题,可以在公众号中提出,只需支付少量赏金,我们会在后期的推文里给予解答。

欢迎关注爬虫俱乐部
微信扫一扫
关注该公众号